Benchmarking is one of the most underestimated tools in the Google Analytics toolkit. If you haven’t already tried it out on your site, go read this post and try it now, then come back here. If you have, excellent.
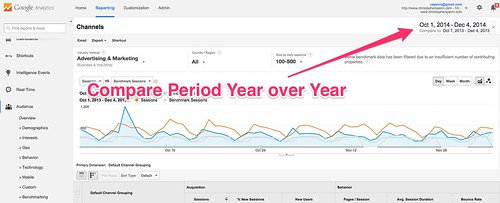
Benchmarking by itself is a useful first look at what’s working vs. what’s not in your analytics versus peer competitors. But suppose you wanted a bigger picture view than just the moment, just right now? Suppose you wanted to see historically so that you could understand what’s changing over time? Luckily, there’s a way to get that kind of insight. Start by turning on your benchmarking and then go to the calendar selector. Select a reasonable period of time in 2014, be it the last month, quarter, or year to date (assuming data is available). Then choose a comparison period of year over year:
Having done this, let’s see what I can interpret from my findings. You’ll notice that you can see this quarter and the same quarter for 2013 stacked up row on row by channel. You’ll also note that I can see how I did versus peer sites in each row.
So what’s of importance? Four things stand out to me in the table above about my website.
1: Social was good this quarter compared to Q4 2013. I was roughly comparable with my peers last year, but significantly ahead of them this year. What I find interesting is not only did my site improve, but my peers fell behind, going from 1418 sessions from social to 1087. What did I change this quarter? Whatever it was, I should improve on it.
2. Organic search still has me above my peers, but I lost 50% of my advantage. I lost 9000 sessions compared to last year. This calls for a fresh look at my organic search strategy and tactics. Where was I getting links from last year? Where did I not get links from this year? Why?
3. At first glance it looks like I narrowed the gap with my peers in referral traffic, going from -43% to -33%, but that’s not really true. When you look at the hard numbers, I’m basically where I was last year and my peers lost ground. That’s not great, so if this were a full time business, I’d be hiring a PR agency right about now and giving them a mandate to go get me placed content on third party sites.
4. When you look at the number of new users that a site gets (third column) rather than just all sessions, you get a sense for how fast your audience is growing. Direct traffic (which very often is mobile traffic in disguise) stands out because last year it was a growing contributor to my site. This year it’s a declining one. Hmm. I’d better put my site through its paces and maybe refresh the design to be more mobile friendly.
By reading through this, you get a sense of what caught my eye. #1 was a trend acceleration, where both the percentages and hard numbers picked up the pace. #2 was a decline masquerading as growth. #3 was stagnation masked as a decline. #4 was a trend reversal. Look for similar patterns in your own analytics and then figure out what happened, why, and what you’re going to do about it.
You might also enjoy:
- Almost Timely News, February 11, 2024: How To Evaluate a Generative AI System
- Almost Timely News: Recipes vs. Principles in Generative AI (2024-03-03)
- Mind Readings: What Makes A Good Conference/Event?
- Mind Readings: Most Analytics Data is Wasted
- You Ask, I Answer: AI Music Collaborations and Copyright?
Want to read more like this from Christopher Penn? Get updates here:
 Take my Generative AI for Marketers course! |


Leave a Reply