Whether you’re using Google Analytics, marketing automation, social media, or any quantifiable metric, one of the simplest, yet most beneficial questions you can ask is:
What does the top quartile have in common?
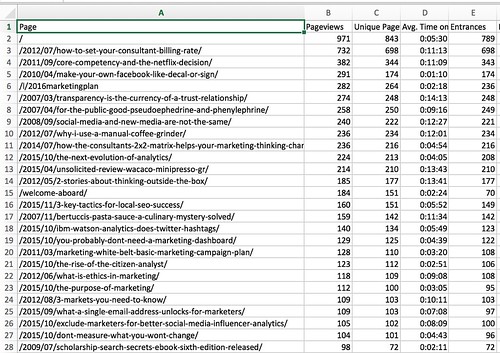
Here’s an example. Look at your Google Analytics for the last quarter, half year, or year by going into Behavior > Site Content > All Pages. Set the list to the top 100, 500, or 1000 pages, depending on how large your site is. Using the Quartile function in your spreadsheet software, identify the top 25% of your pages by volume.
What do your top pages have in common?
Were they written around a particular topic?
Were they written during a particular period of time?
Does the traffic to those pages come from a particular source?
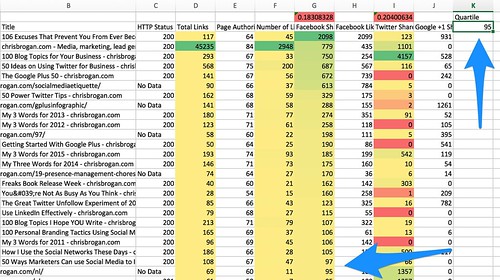
You don’t have to limit this analysis to Google Analytics, either, or just your own website. Here’s an example of the Facebook shares and inbound links to my friend Chris Brogan’s website:
Above, we can see that 95 shares constitutes the line separating the top quartile from everything else. What do you see in his top posts by Facebook share?
Look in your own metrics and analytics. What’s common? What can you learn about what resonates with your audience, and can you make more of it, if more audience is a goal?
You might also enjoy:
- Almost Timely News: Principles-Based Prompt Engineering (2024-02-25)
- Almost Timely News, February 11, 2024: How To Evaluate a Generative AI System
- You Ask, I Answer: AI Music Collaborations and Copyright?
- Mind Readings: You Need Passwords for Life in the Age of Generative AI Fraud
- Almost Timely News, January 7, 2024: Should You Buy a Custom GPT?
Want to read more like this from Christopher Penn? Get updates here:
 Take my Generative AI for Marketers course! |


Leave a Reply