How do you know whether your content game is getting better or worse? It’s easy to rely on stock analytics tools, and for the beginning content marketer, tools such as Google Analytics are more than enough. For the veteran marketer who is creating content, how can we know with greater precision whether our content is getting better or worse? How can we more quickly diagnose the bad, double down on the good, and make our program sing?
In part 3 in this series, we begin to extract more meaning from the data we’ve collected in part 1 and charted in part 2. Be sure you’ve read and done the steps in those early parts first.
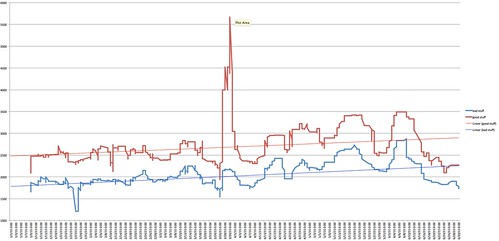
Let’s now consolidate the graphs of the good stuff and the bad stuff into one picture, so as to see everything more comprehensively. I’ll reapply the trend lines as well:
We can see that both trendiness are going up. Let’s start with that basic form of analysis and examine some different combinations and what they could mean.
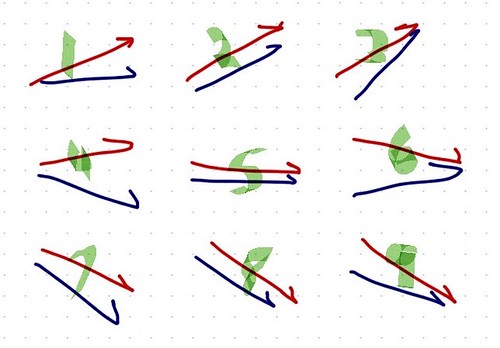
Above, there are a total of 9 scenarios you might see in your trendlines. Let’s explore what they are and what they might mean. I’ll remind you from yesterday that good stuff refers to the best 25% of your content, the most popular content. Bad stuff refers to the lowest 25% of your content, the least performing content.
Scenarios 1-3: Content Marketing working well
[1]: Good stuff ascending faster than bad stuff. This is the best possible situation. All your content is improving, but your headliners, your big content, is punching above its weight. Keep doing what you’re doing, and double down on your best ideas.
[2]: Good stuff ascending at the same rate as bad stuff. This is a sign of an overall strong content marketing program, steady improvement across the board. The next important thing would be to develop some big ideas and amplify the great hits you’ve already got.
[3]: Good stuff ascending slower than bad stuff. Your least performing content is making strides to become better. Now’s the time to start dreaming up some big ideas to take your best stuff to the next level.
Scenarios 4-6: Content Marketing might be in trouble
[4]: Good stuff ascending while bad stuff descends. You still have great hero content, but your maintenance content is suffering. Either you’ve tapped out your audience or your content simply isn’t of interest most of the time. Find someone to do a better job with the topics and content formats you’re not good at.
[5]: Good stuff and bad stuff remain neutral. Your content marketing is working okay, but not improving. This is a sign that you need a jolt of creativity and different thinking.
[6]: Good stuff descending while bad stuff ascends. Often, this is a sign that you’ve spent so much time shoring up your weak areas that you’ve let the important areas go. Get your big ideas back on track.
Scenarios 7-9: Content Marketing definitely in trouble
[7]: Good stuff descending slower than bad stuff. Both areas are declining, but your top content still holds some influence. Use it to reboot your program. Do thorough analysis and throw overboard the types of content, ideas, and topics that are least performing.
[8]: Good stuff descending at the same rate as bad stuff. This is general bad news. You’re headed for the bottom. This is when you reboot everything.
[9]: Good stuff descending faster than bad stuff. This is the worst possible situation. Your best content is losing ground rapidly, and whatever traction your bad content has is probably so small that the rate of decline is meaningless, bottoming out.
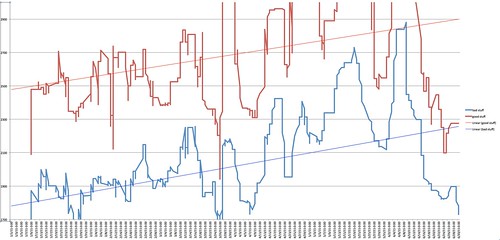
If we take the chart from earlier and compress the axes down to just the ranges where the trendlines are, we can see which scenario is at work in my own data.
What we see above is scenario 2. I now know what I need to do in order to move my content marketing program ahead.
In the next post in this series, we’ll look at measuring the distance between your good and bad stuff, and how to interpret that measurement.
You might also enjoy:
- Almost Timely News, January 7, 2024: Should You Buy a Custom GPT?
- You Ask, I Answer: AI Music Collaborations and Copyright?
- You Ask, I Answer: Legality of Works in Custom GPTs?
- Mind Readings: What Makes A Good Conference/Event?
- Fireside Chat: Geraldine Deruiter on Food, Feminism, and Fury
Want to read more like this from Christopher Penn? Get updates here:
 Take my Generative AI for Marketers course! |


Leave a Reply