One of my favorite “secret” measurement tools is the Google Analytics Add-on for Google Sheets. This powerful tool lets you extract up to 10,000 records from your Google Analytics account in spreadsheet format. Your data becomes available to you in many rows and columns which you can slice and dice to find the insights you need.
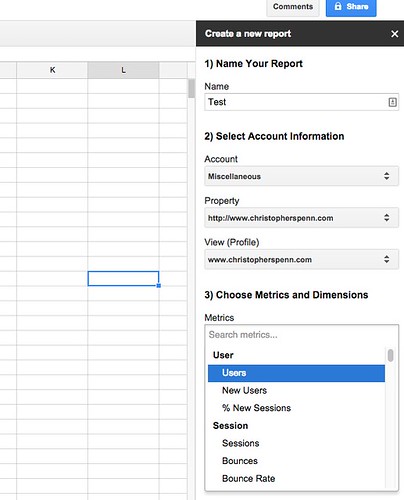
Downloading the add-on is fast and free as long as you have a Google account (a Gmail address). Once you’ve followed the instructions, you’re presented with a wizard that attempts to set up the first report for you.
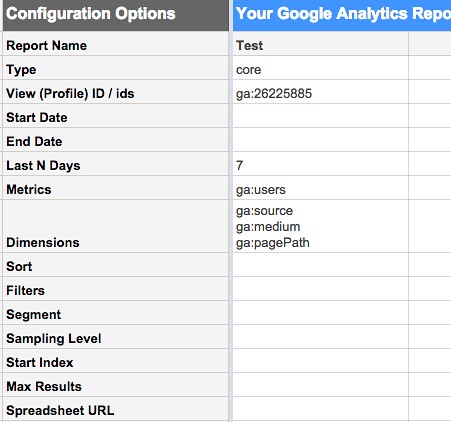
Decide what metrics and dimensions you want the report to pull, and it’ll bring you to a configuration sheet. Below, I’ve selected the number of users by source and medium, to each page on my website:
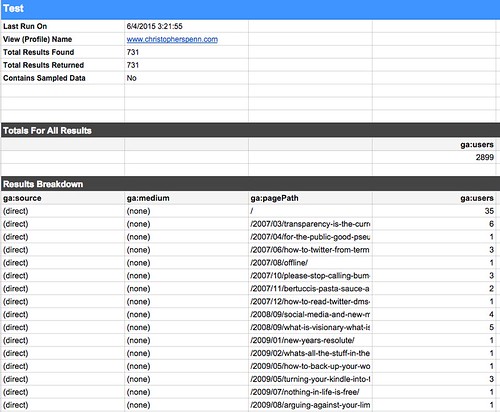
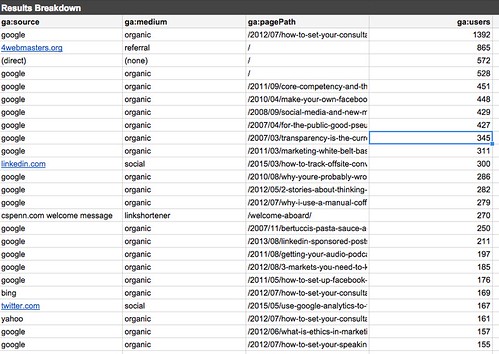
When I go to the menu and hit Run Report (which isn’t obvious from the above configuration screen), I get this result:
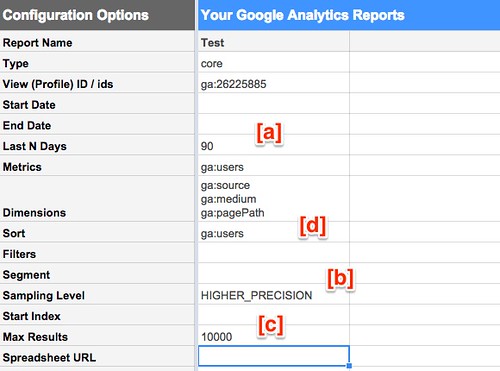
This is a great start. Here are 4 tips to make life easier and better. In the configuration screen, you may want to widen the timeframe [a]. I like 30 and 90 day windows of time. You may want higher precision (which makes the report take longer to run) in your data, [b]. You may also want more results. By default, it returns 1,000. You can move this up to 10,000 at [c]. Finally, you may want to start out with a sorted pile of data, so put any metric in the sort field [d].
Now you’re set to re-run the report:
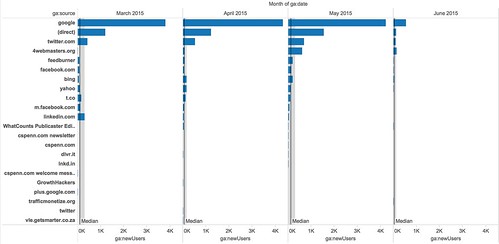
What you get is a more granular look at your data. You can then export the data to the analysis tool of your choice to look for additional insights. For example, I looked to see what sources were driving new users to my website in Tableau 9:
This tells me that Twitter, despite being very noisy these days, is still in the driver’s seat for social media for me. That’s where I’ll invest if I need new visitors to my site.
The Google Analytics Spreadsheet Add-On makes exporting lots of data very simple. Give it a try, see what data you can pull out of it to make your reporting life easier!
You might also enjoy:
- Almost Timely News, February 4, 2024: What AI Has Made Scarce
- You Ask, I Answer: Retrieval Augmented Generation for Tax Law?
- You Ask, I Answer: AI Works And Copyright?
- Mind Readings: Hacking Social Media Algorithms
- Almost Timely News: Recipes vs. Principles in Generative AI (2024-03-03)
Want to read more like this from Christopher Penn? Get updates here:
 Take my Generative AI for Marketers course! |


Leave a Reply