As marketers in the always-on, all-data-all-the-time mindset, we often forget to look backwards. In fact, looking back more than a month or a quarter is generally frowned upon, with snarky comments such as “having both feet firmly planted in the past”. That said, there can be tremendous value in a much bigger picture perspective.
Try this, the next time you’re rooting around in your analytics cellar, looking for insights. Take your data over a much longer period of time and look for seasonality over the years. Here’s an example:
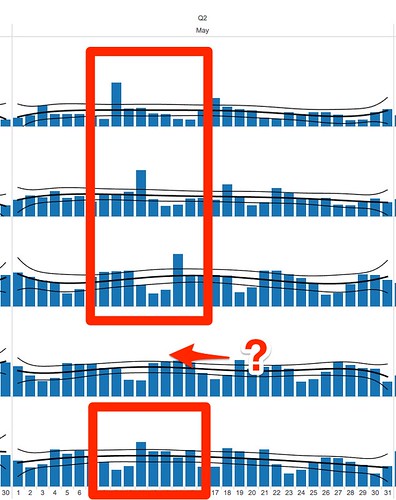
I took the most basic measure, site visits, and grabbed 5 years of data out of Google Analytics, put it in a spreadsheet, and then sliced it up so that it was year over year, rather than one long chart.
When I went cruising through the data, I noticed that my blog got a decent amount of traffic, above and beyond the normal, right around the second weekend of May. I also noticed that it failed to happen in 2013, but came back somewhat in 2014.
From this interesting find, I’d need to go dig into why. Looking more carefully in the data, there’s a blog post that always seems to get attention again at that time of year, year after year.
So with that, what do I do about it? Well, when 2015 rolls around, if this were my business, I’d consider doing an integrated marketing campaign around that time. Maybe I’d do some paid media. Maybe I’d remix the post into an infographic. Maybe I’d hire a PR firm to pitch it to the media to get some different eyeballs on it. If this were my full time business rather than a personal blog, I’d double down on that time period and that content to see if I could take advantage of what is obviously a multi-year, seasonal trend.
Do the same with your own data. Take a break from focusing on yesterday’s numbers to look at yesteryear’s trends and see if there’s something obvious that you’re missing!
You might also enjoy:
- You Ask, I Answer: Retrieval Augmented Generation for Tax Law?
- You Ask, I Answer: Retrieval Augmented Generation vs Fine-Tuning?
- Almost Timely News, February 11, 2024: How To Evaluate a Generative AI System
- Almost Timely News, February 4, 2024: What AI Has Made Scarce
- Mind Readings: Most Analytics Data is Wasted
Want to read more like this from Christopher Penn? Get updates here:
 Take my Generative AI for Marketers course! |


Leave a Reply