Klout scores have been evolving over time, and the most recent change to the algorithm and to scoring led me to go back to a dataset that I’ve been working with for over a year now to see what’s different.
Before we begin, the usual disclosures and disclaimers. This set of tests was done with a dataset from my audience on Twitter. It’s a niche audience of folks largely focused on digital marketing, which means that it’s not representative of the general public. I also interact with my audience in peculiar ways, including using a variety of tools to do some funky automated stuff. Thus, my audience should not be interpreted to be representative of the general public and certainly not representative of your audience. The dataset has remained consistent in terms of whose Twitter IDs were used over all 3 time periods below, making this a longitudinal study of a biased dataset.
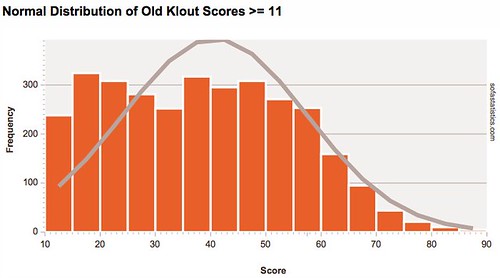
Prior to the amusingly titled “Kloutpocalypse” in the second half of 2011, the average distribution of Klout scores among some of my followers looked like this:
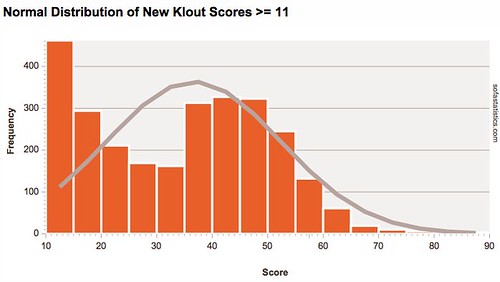
After the “Kloutpocalypse”, the scores shifted dramatically to the left:
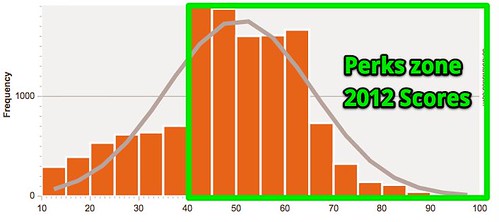
Klout recently made the announcement that they’re now taking into account more data points. Based on this same pool of people, it seems like they also heavily normalized scores. Here’s the score pool as of August 16, 2012:
Notice how much more closely scores fit the grey normal curve line than the past two sets of scores.
What does that mean? When you normalize data, you’re trying to develop a sense of how normal an individual data point is. For example, with these new Klout scores, by normalizing around a Klout score of 50, Klout is effectively saying the “average” social media user’s score should be about 50. How far away from 50 your individual score is indicates (according to Klout’s algorithm) how much more or less influential you are than the “average” social media user.
In fact, if you look at the normal curves for all three data sets, we see that the normal curve average in the pre-2011 data was about 45. That shifted dramatically downward to about 37 in the second half of 2011, and now shifted upwards to 50 in the latest version of their scoring system. Generally speaking, your Klout score has probably gone up, perhaps significantly, unless you were already several standard deviations away from the mean on the upside.
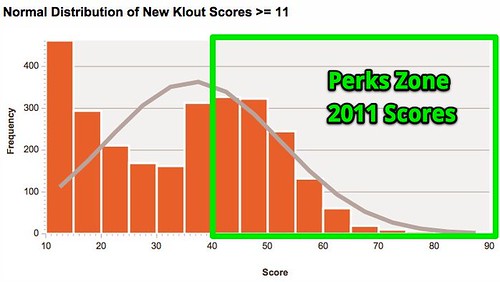
Why the change? Why normalize the data? I can’t say. Joe Fernandez and his team would be the only ones who could authoritatively answer that. I can say this: if you browse around Klout’s Perks site, you’ll see that a number of perks have a requirement of a baseline score of 40:
If you look back at the previous algorithm versus the current algorithm in terms of raw score eligibility, you can see a pretty big difference in the number of people who qualify for perks based on score (not necessarily topics).
2011 Perks Zone:
2012 Perks Zone:
A much larger chunk of audience is now score-eligible for Klout Perks. So if your score went up and is now over 40, enjoy looking around for Klout Perks. Again, only Joe Fernandez and his team can say whether there was an explicit commercial motivation in normalizing the scores, but the outcome is clearly that more people are at least score-eligible for Perks.
I hope this longitudinal look at Klout scores is helpful to you as you wonder what happened with your Klout score. Please feel free to share this post with anyone who’s wondering why their score changed so dramatically recently.
You might also enjoy:
- You Ask, I Answer: Retrieval Augmented Generation for Tax Law?
- Almost Timely News, January 28, 2024: Copyright Must NEVER Apply to AI-Made Works
- Almost Timely News, January 7, 2024: Should You Buy a Custom GPT?
- Mind Readings: Hacking Social Media Algorithms
- Fireside Chat: Geraldine Deruiter on Food, Feminism, and Fury
Want to read more like this from Christopher Penn? Get updates here:
 Take my Generative AI for Marketers course! |


Leave a Reply